Interpreting Arbotom sonic tomography results – Example no.1
Sonic tomography uses the relative velocity of sound waves, induced across the stem, to construct a two-dimensional picture (a tomogram) that shows zones of different sound transmission properties.
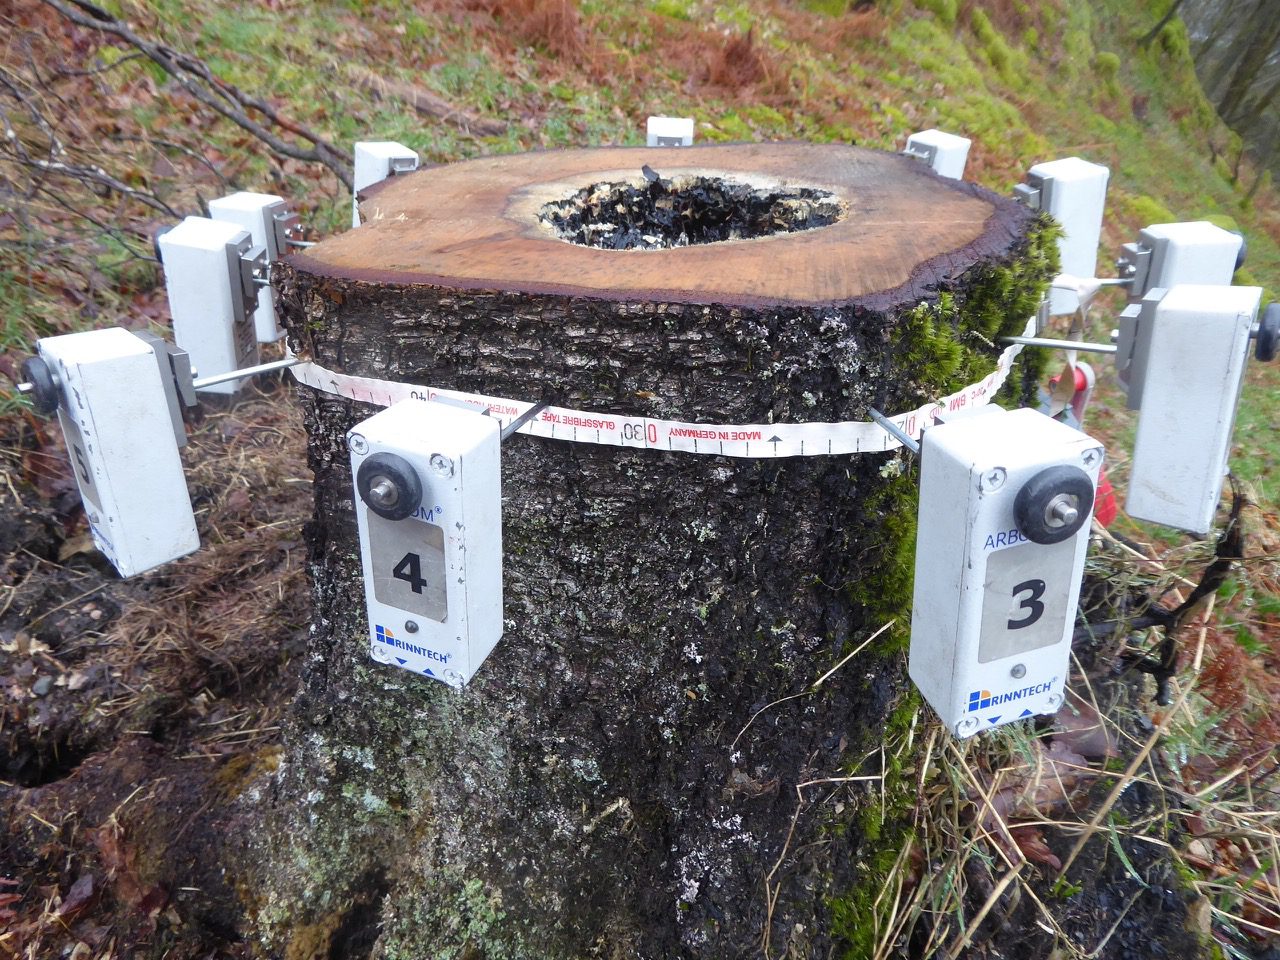
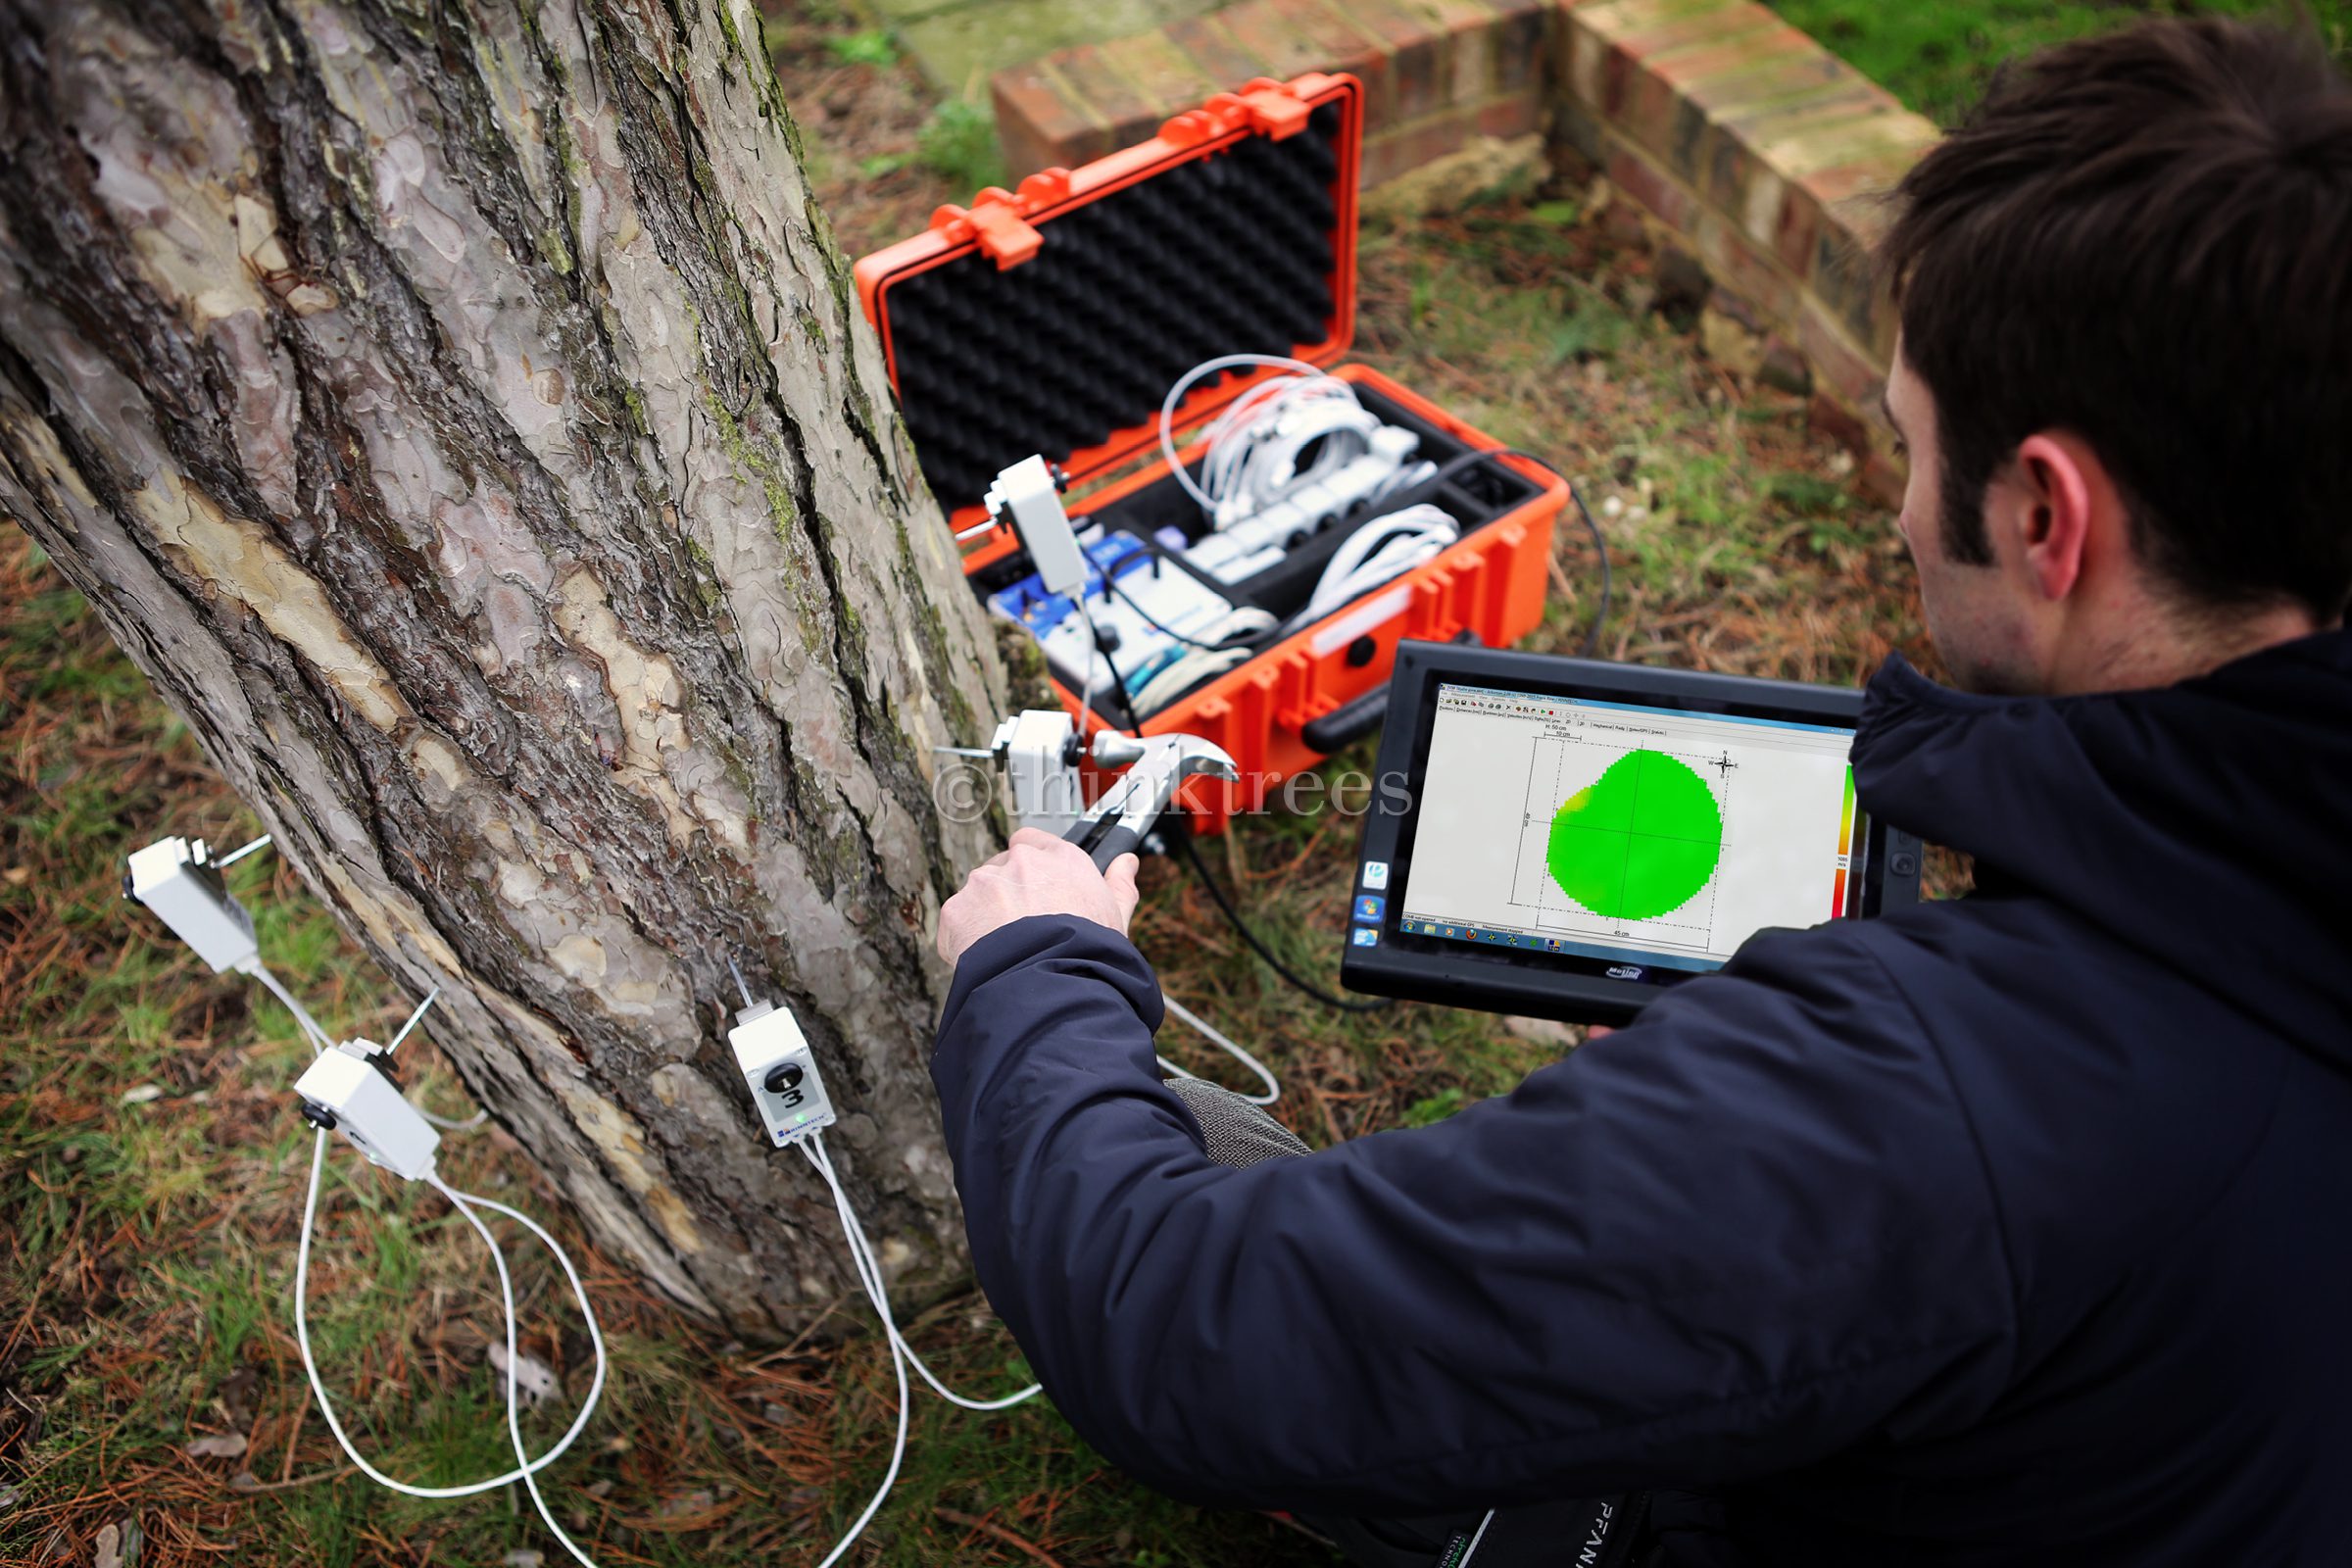
To achieve this, sensors are positioned around the circumference of the stem. These are attached to pins that are inserted through the bark so that they are in contact with the wood. The distance between each of the sensors is calculated using either a method based on their position on the measuring tape around the circumference and then estimating how much the position of each sensor deviates in or out from a perfect circle, or by measuring the exact distance between each sensor using callipers. During a test the sensors measure the time it takes for the sound waves to reach each of the sensors. This information is then combined with the distance each sound wave has travelled to calculate the velocity.
Birch stump
Recently, a contractor has been removing the wind-blown trees from a woodland near to where I live. In the majority of cases the stumps of the wind-blown trees have sprung back into an upright position once they have been cut. The abundance of relatively high, freshly cut stumps has provided me with a perfect opportunity to select stem cross-sections that possess interesting features, such as hollowing or splits, and to observe how these features influence the transmission of the sound waves in a sonic tomography test and to see how they are depicted in the tomogram.
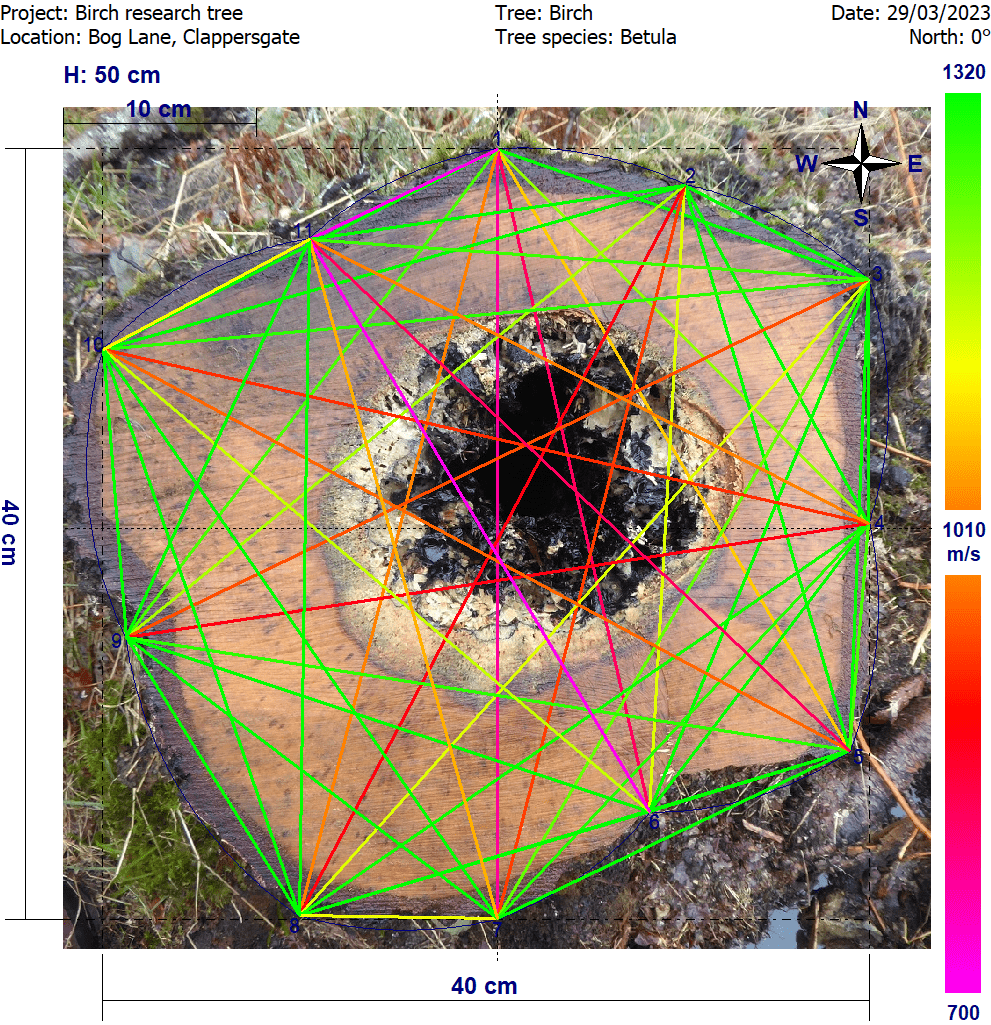
Line graph showing velocities between each sensor
The following test was carried out on a birch (Betula sp.) stump approximately 40cm in diameter. Eleven measuring points (sensors) were used for the test. The velocity between each of the sensors is shown in the line graph above. The fastest velocities are shown as green and the slowest are shown as red and purple. The graph has been combined with a photograph of the cross-section to show how the centralised hollowing and decay influences the sound transmission.
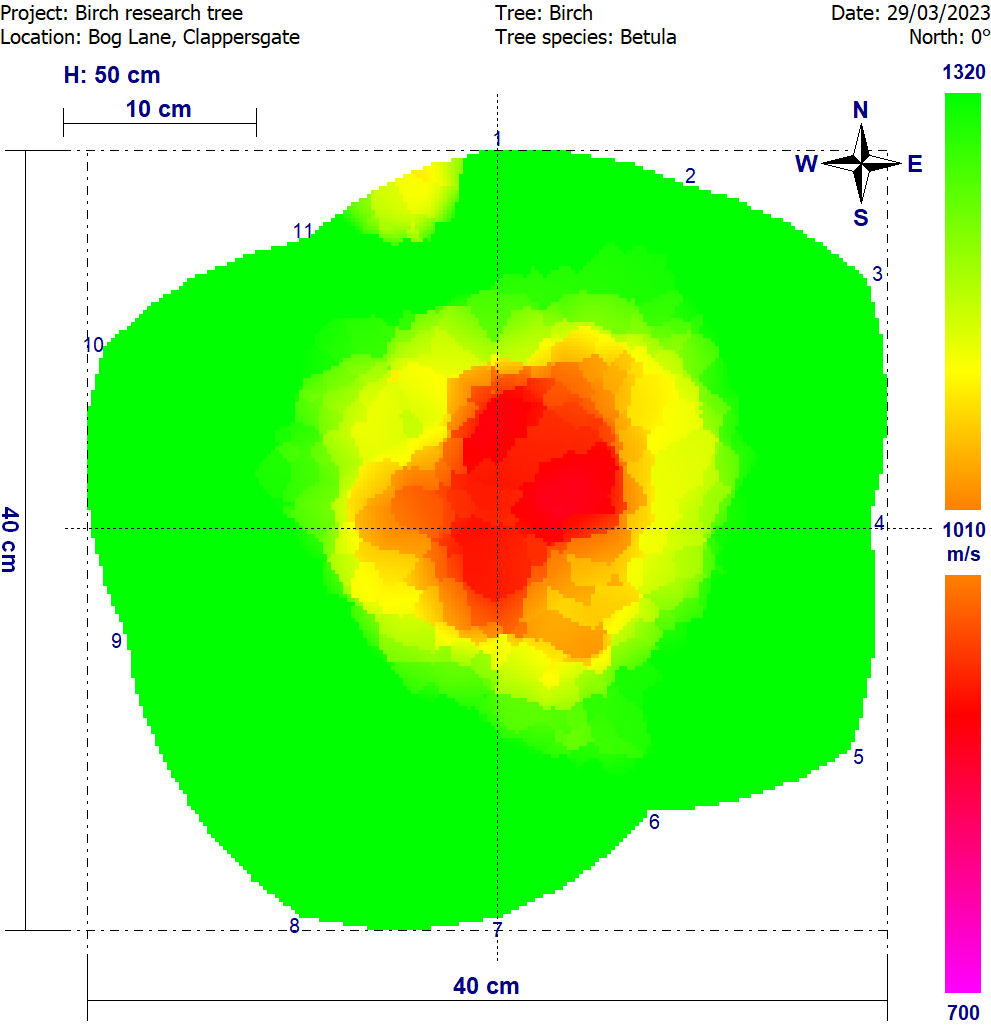
Tomogram
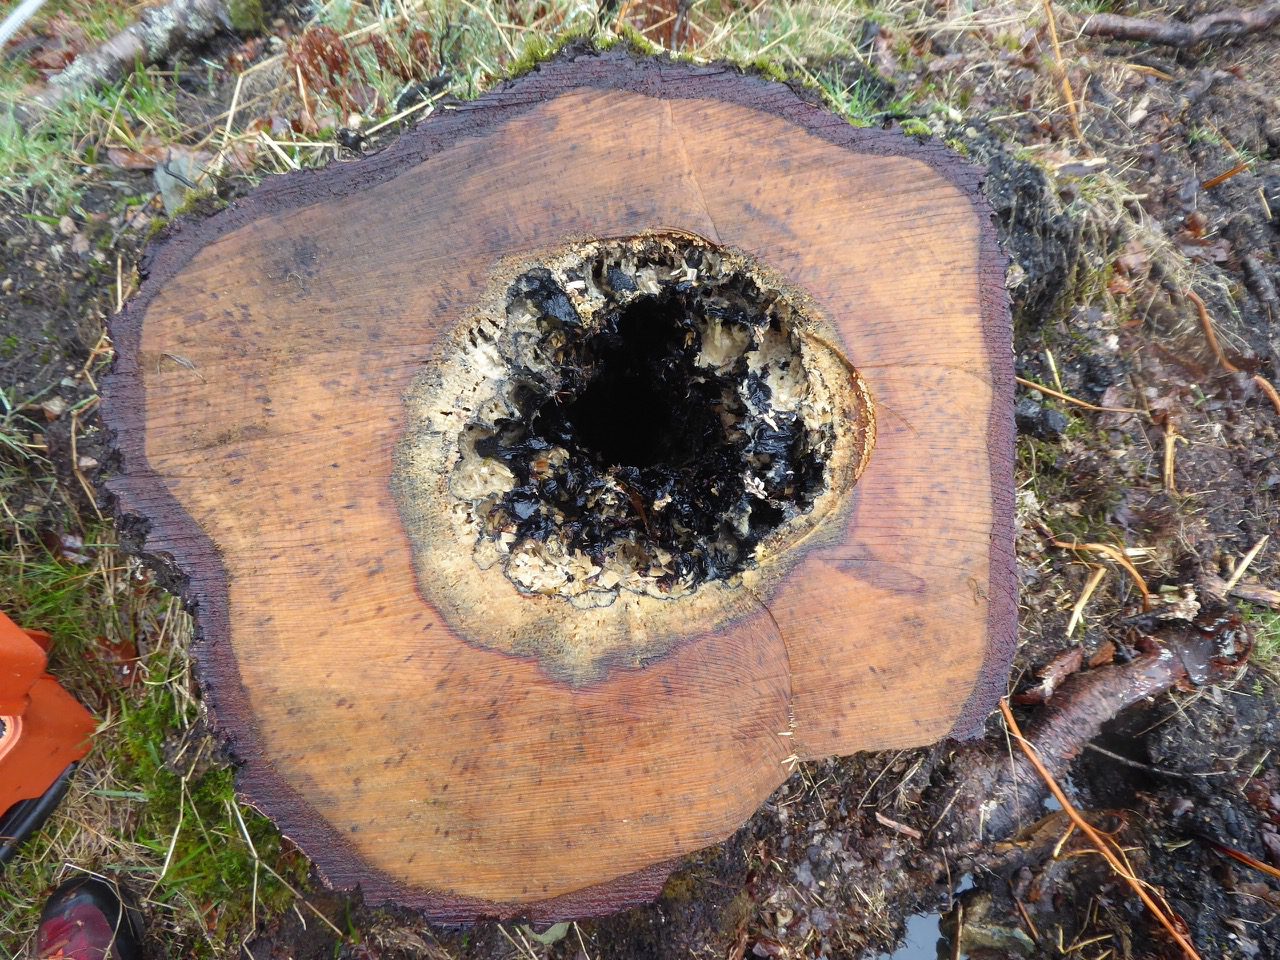
Cross-section of birch stump
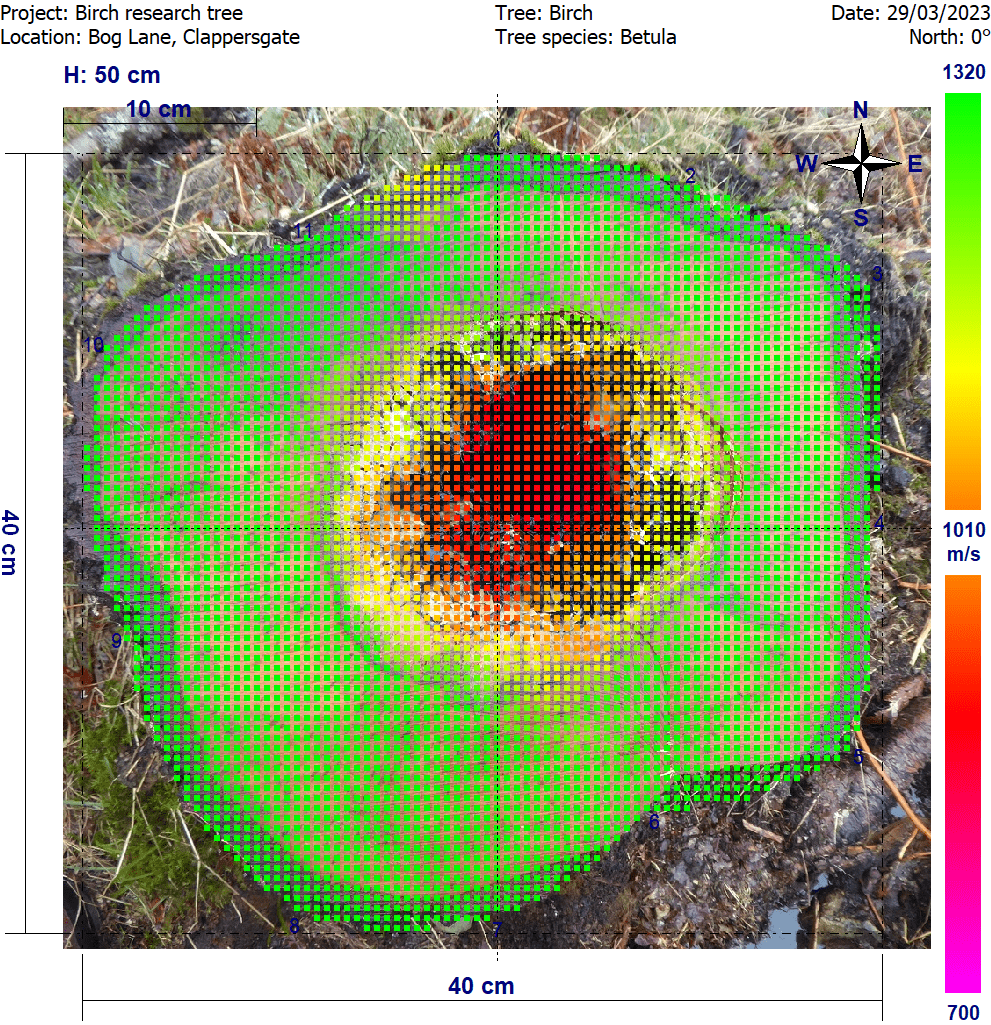
Cross-section overlaid with tomogram
The Arbotom software uses an algorithm to produce a picture (tomogram) depicting the cross-section of the stem based on the velocities shown in the line graph. It is clear that the tomogram produced in this case is a fairly accurate depiction of the cross-section, showing clearly the centralised column of decay and hollowing. However, it is important to note that the data collected during the test, on which the tomogram is based, was filtered or ‘cleaned’. The velocities measured during the test ranged from 250 m/s to 1320 m/s. The tomogram shown above is based on a range of 700 m/s to 1320 m/s which was selected to omit several outlying data points, principally those recorded between sensors 1 and 11 and 8 and 7.
The scatter graph below shows the distribution of velocities. The velocities below the red line were omitted. The tomogram produced using the default settings in the software shows the decay in the same position and covering a similar area as the modified tomogram, however the colour (yellow) indicates that the decay is less advanced than it actually is. The reason for this is that the outlying data points increase significantly the range of velocities, making the mid-range velocities (which, in this case, are most representative of the sound transmission properties of the decayed and hollow wood) show up as yellow rather than red or purple.
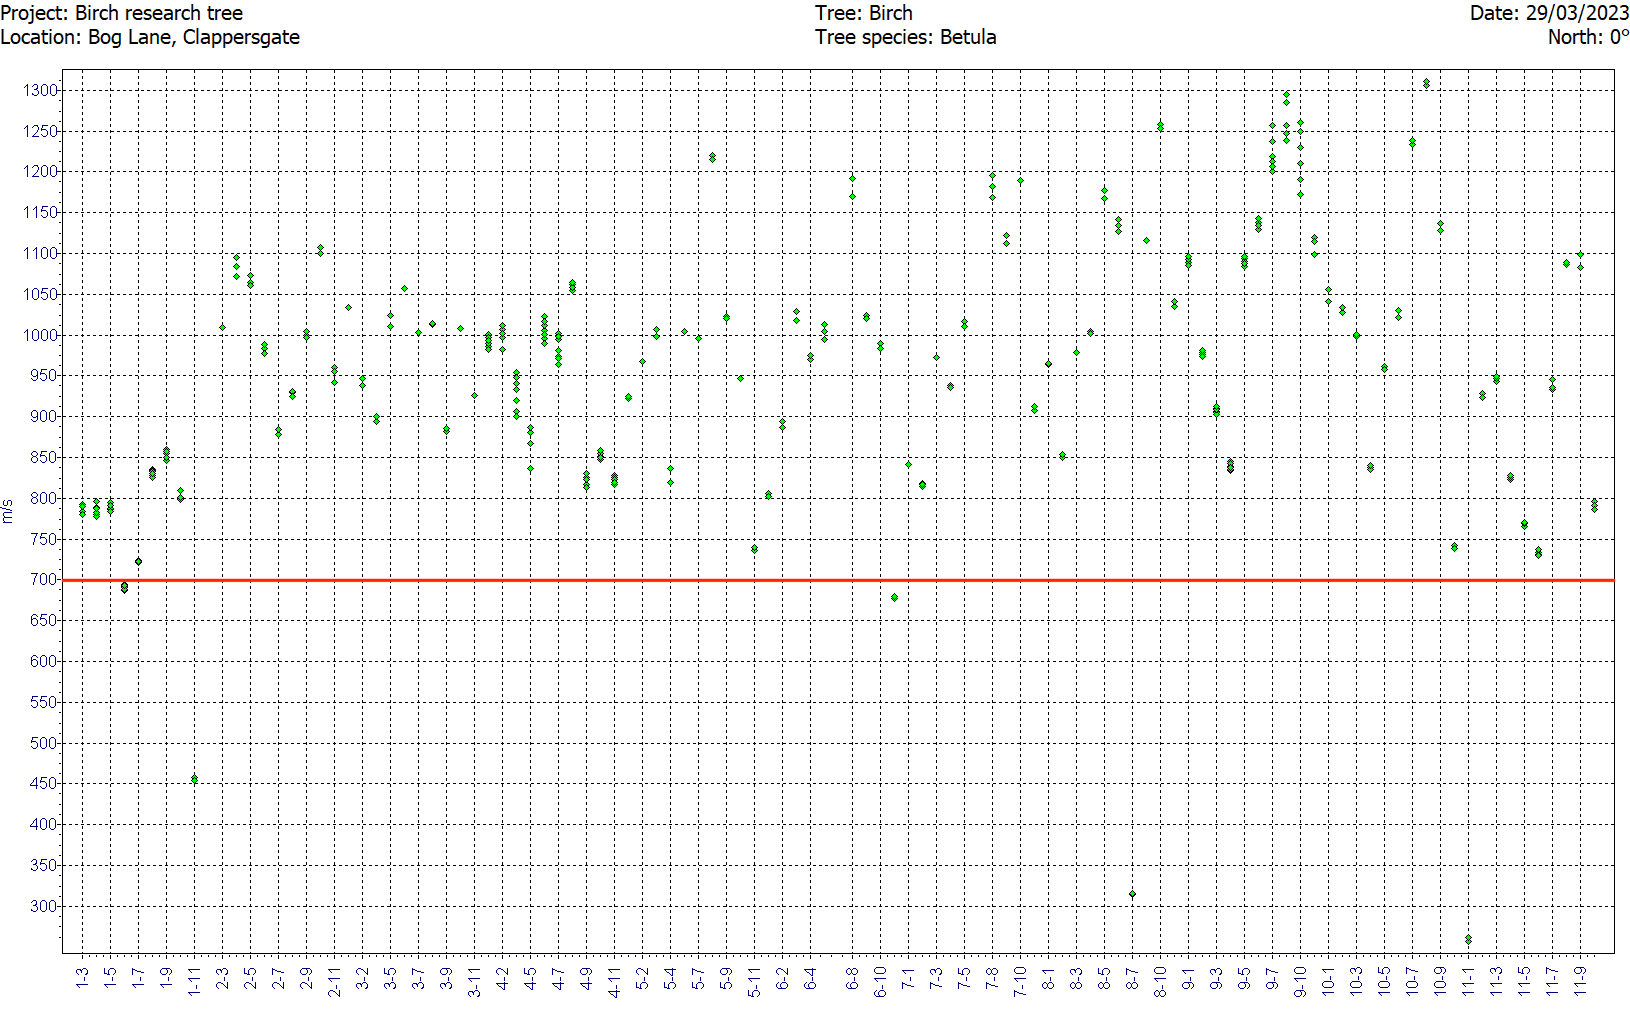
Scatter graph showing distribution of velocities
Sonic Tomography
Decay in trees can weaken wood enough to increase the chance of mechanical failure. However, in many instances… READ MORE
Testimonials
Over the past ten years we have established a close working relationship with many of our clients, many of whom... READ MORE
Contact Us
We are happy to help with any tree-related queries so whatever your requirements...READ MORE